Project Overview
I built this project using C++ and SDL2 to visualize some of the common sorting algorithms. This project renders sorting algorithms as animated bar graphs, allowing users to observe how different algorithms approach the same problem with varying efficiency patterns.
Key Features
- Five Popular Sorting Algorithms: Selection Sort, Bubble Sort, Insertion Sort, Merge Sort, and Quick Sort
- Real time Visualization: Watch as the algorithms reorganize the data step by step
- Interactive Controls: Select your preferred algorithm and customize array size
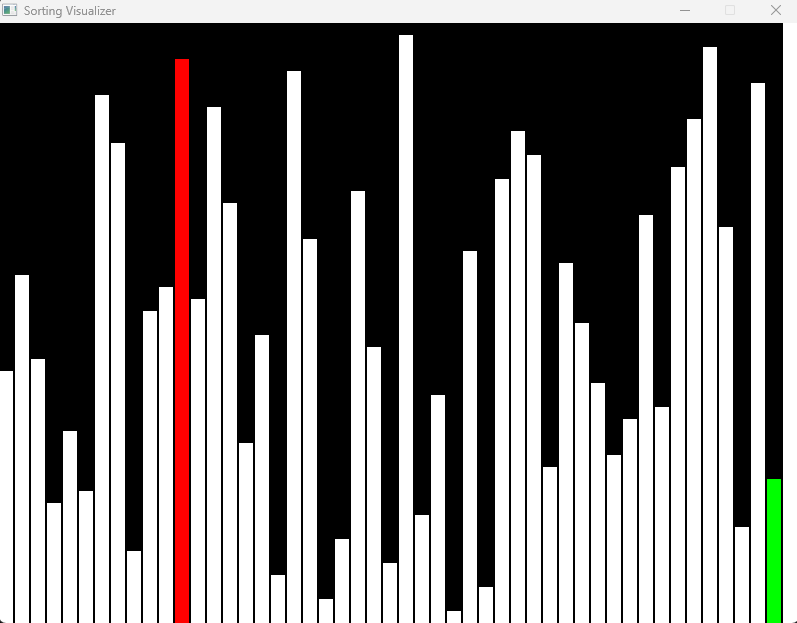
- Color coded Elements: Red highlights the current element being compared, green shows the minimum value or partition point
Technical Implementation
This project leverages the SDL2 graphics library to create a clean, responsive display. The program:
- Initializes an array with random values
- Renders each value as a vertical bar
- Animates the sorting process by redrawing the screen after each comparison or swap
- Uses color coding to highlight important elements during the sorting process
What I Learned
Building this visualizer deepened my understanding of:
- Algorithm Complexity: Seeing the difference between O(n²) algorithms like Bubble Sort and O(n log n) algorithms like Quick Sort in real time
- Graphics Programming: Using SDL2 to create frame by frame animations
- User Interface Design: Creating intuitive visualizations that clearly communicate technical concepts
- C++ Implementation: Managing memory and optimizing rendering performance
Future Enhancements
I plan to expand this project by:
- Adding more sorting algorithms (Heap Sort, Radix Sort)
- Implementing speed controls for the animations
This project combines my passion for computer science fundamentals with creative visualization, demonstrating how technical concepts can be made more accessible through thoughtful design.